Hello everybody, I hope every one of you is healthy and doing OK. I haven’t written in a long time and I wanted to get back to write another blog post, maybe I can distract you from all the bad news.
Recently I stumbled upon an old Tableau WorkoutWednesday challenge from way back in 2017. In this post Zen Masters Andy and Rody challenge us to create 100 data points as bar charts that are in one row and 5 columns – groups of 20 bars – and they want us to use just one Tableau sheet! I bet must of you already did this exercise, but I’ve been procrastinating it since 2017 to try to solve it and this blog post is about how I solved it.
I found this challenge particularly useful and applicable to many real world applications, when we need to show bar charts and if they have many items on them they get really crowdy, we usually do a top 5 or 10 or whatever to cut them off or they show an automatic scrolldown, but our users some times want to see the whole picture.
One option is to make several charts and group them in a container, it’s straight and easy but could be tedious to create and complicate our dashboard. This solution is practical because we would have everything in just one sheet and it needs just a few calculations, a little bit tricky but nothing too complicated.
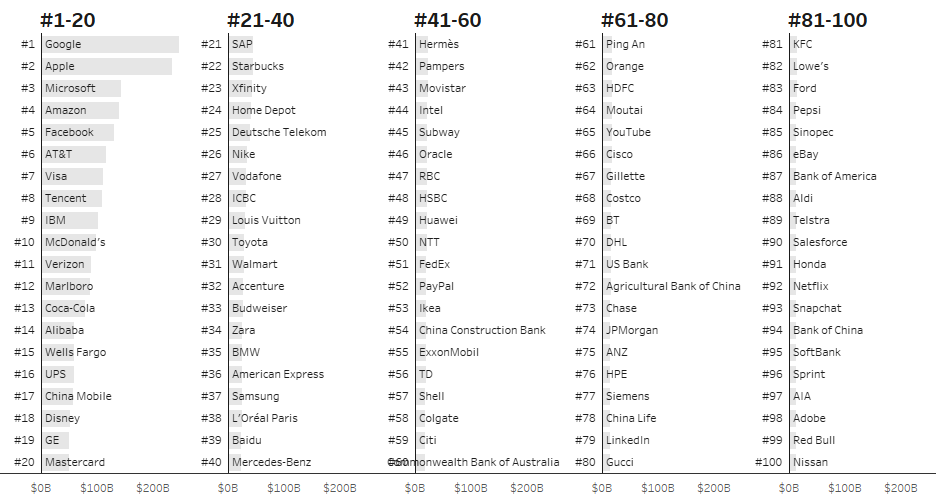
We want to get to this:
OK, let’s get our hands dirty!
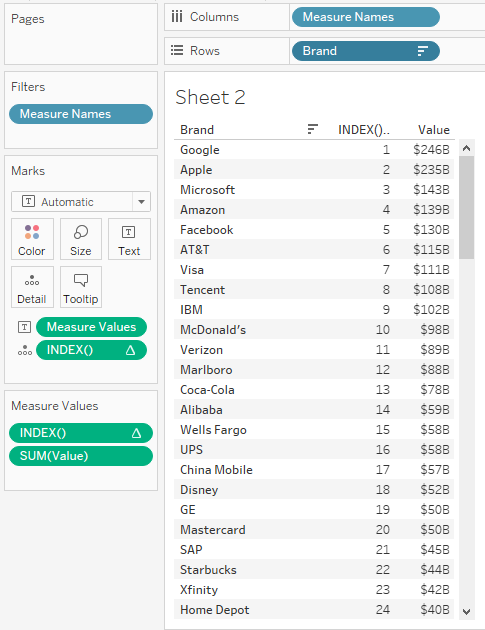
The dataset consists of just two fields, [Brand] and [Value], that’s it, we’re going to use a bunch of Table Calculations, I suggest you to first make a table with our fields, it’s easier to work with Table Calcs when we use one. We are going to use the INDEX() formula first, just add it to our table, sort the [Brand] field in descending order by the SUM() of the [Value] field, like this:
Nothing fancy, right? OK, we can see in the picture of the final result that [Brand] is separated in 5 columns of 20 rows, 1-20, 21-40, etc. But how we get to that? Another way to think about it is that we have 5 columns with a row counting from 1 to 20, somehow we have to “normalize” the INDEX() consecutive count to restart every 20 rows instead of going from 1 to 100 all the way.
The modulo operator (%) to the rescue! As described on Tableau’s documentation:
The % operator returns the remainder of a division operation. For example, 9 % 2 returns 1 because 2 goes into 9 four times with a remainder of 1. Modulo can only operate on integers.
If we apply the modulo operator to our INDEX() formula “modulo” by 20 (the number of items on each of our 5 groups) we get the following:
[New Index]

INDEX()%20
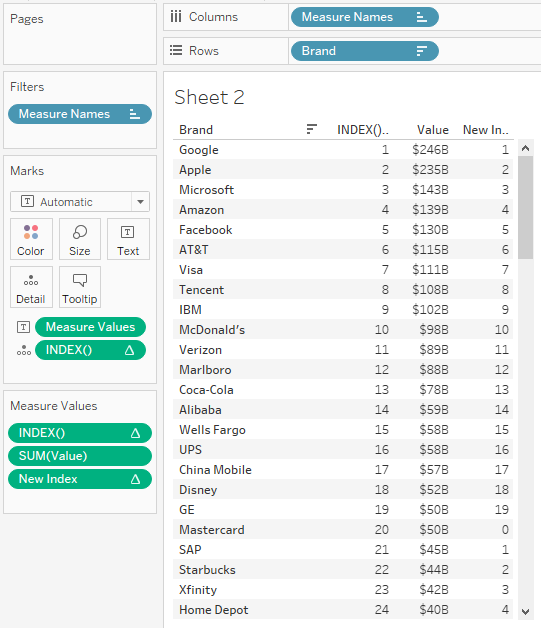
Great! Now we have a count that restarts every 20 rows… well, kind of… did you catch our problem? In the very first row we have a 1 and in the 20th row we have 0! That’s the result of our modulo operation, nothing to worry it’s an easy fix, we just need to change our [New Index] field a little bit:
[New Index]
(INDEX()-1)%20
We just subtract one to our INDEX() so it starts at zero (the INDEX formula always starts at 1), now we got this:
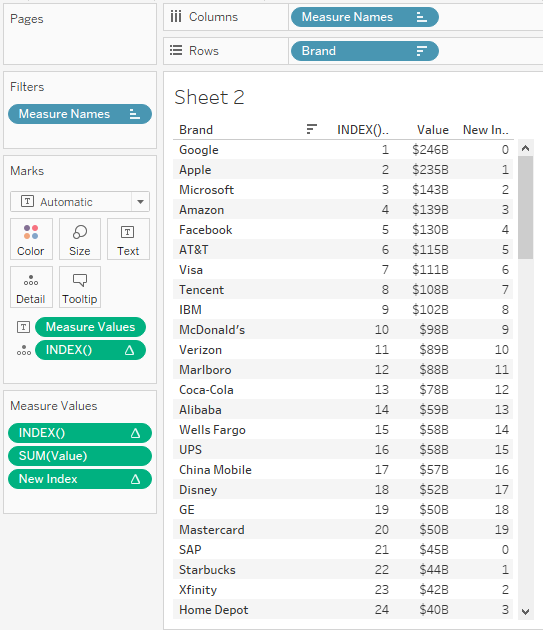
Our counting goes from 0 to 19 (20 rows) and then restarts to 0, 1, 2, 3 and so on, that’s what we wanted, this calculation will be used for the rows in the final bar chart.
Now we are going to calculate our 5 groups: 1-20, 21-40, 41-60, etc. It gets a little bit tricky and it is all based on the modulo operator, it takes a bit of time to get around how it is applied but once you get it, it’s very useful for many applications in Tableau. The modulo is highly used in programming and computers use the floor function to calculate it, this is key too.
In mathematics and computer science, the floor function is the function that takes as input a real number x and gives as output the greatest integer less than or equal to x, remember this on the next paragraphs!
l want to create 5 groups of 20 rows remember? I’m going to split the whole process into 2 formulas for a better explanation, first we create the following calc and make a copy of the same [Step 1 (copy)], the original will be formatted to zero decimals and the second to 2 decimals:
[Step 1]
(INDEX()-1) / 20

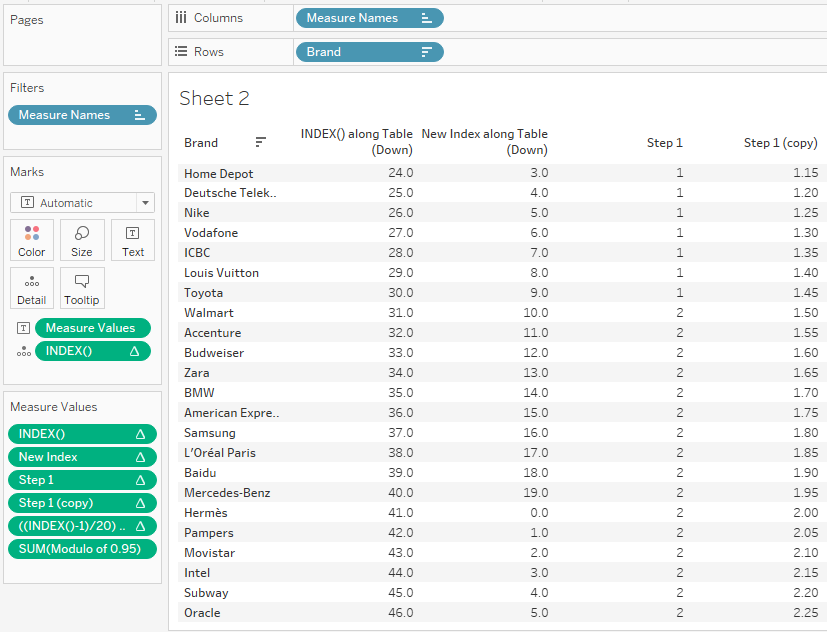
As you can see with [Step 1] we get 0’s but in reality they are numbers less than 0.50 and we get 1’s but in reality they are numbers less than 1.00 as demonstrated by the [Step 1 (copy)] field, we have the same behavior with the 2’s, 3’s, 4’s and 5’s.
Now, can you see it? The integer part of the [Step 1 (copy)] field is what we are interested in because If we get only that part we would get 20 rows with 0’s, 20 with 1’s and so on, a count from 0 to 4 which means 5 groups of 20 rows! How to get that integer? Well… you guessed it, with another modulo operation:
[Grouping]
( (INDEX() - 1 ) / 20) % 20

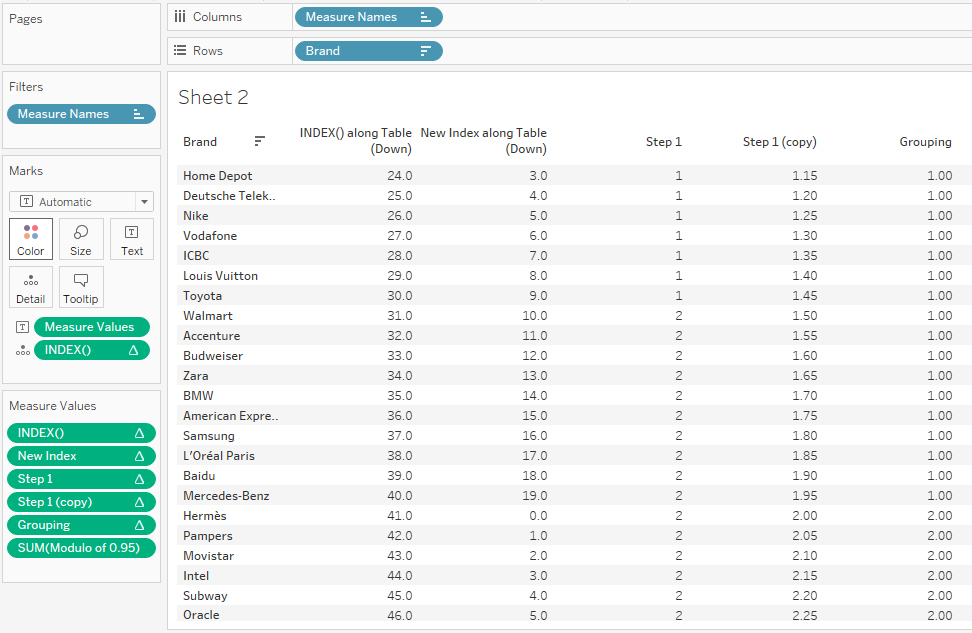
You can see how the [Grouping] field only contains the integer part of the [Step 1 (copy)] field, now we have our 5 groups. But why we get only integers with this calculation? I have 1.45 and got 1.00, I have 1.75 and get 1.00 again! Because of the internal floor function that is used internally by the modulo operator, remember, the floor function takes as input a real number x and gives as output the greatest integer less than or equal to x, so if the input is 1.45 the greatest integer that is less than or equal to 1.45 is 1, the same occurs with the rest of the numbers.
Now, we have the foundational calcs we need to create our bar chart. To create our groups as seen in the final chart we need the following calculation, this will separate the 5 groups and give the header labels:
[20 places blocks]
CASE [Grouping]
WHEN 0 THEN " #1-20"
WHEN 1 THEN " #21-40"
WHEN 2 THEN " #41-60"
WHEN 3 THEN " #61-80"
WHEN 4 THEN " #81-100"
END
This formula just gives the groups a label according to the group they belong to.
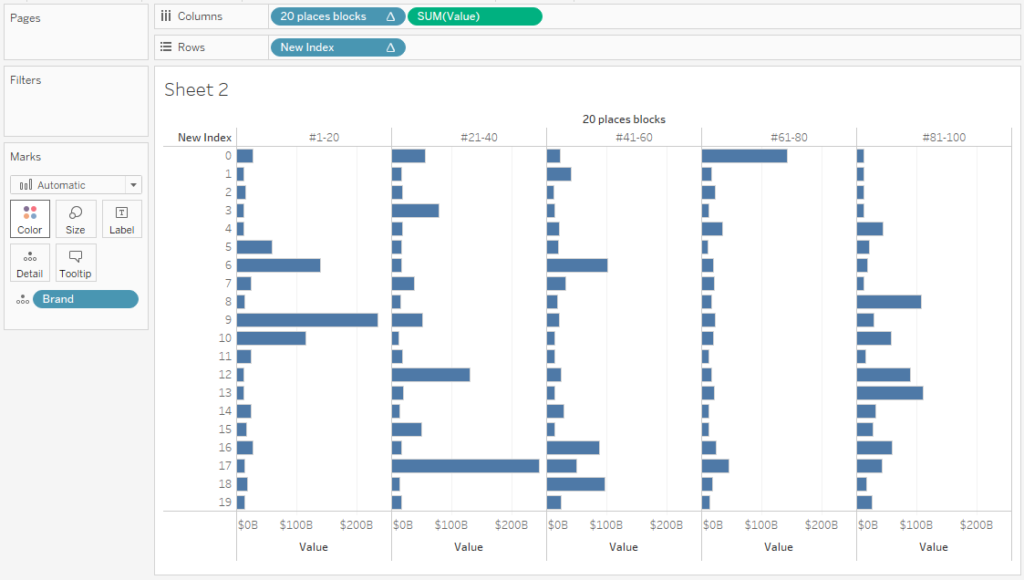
Drag [Brand] to the Details Card, [20 places blocks] to Columns and set it to Compute using Brand then drag [New Index] to Rows and change it to Discrete and set it to Compute using Brand, next drag SUM(Value) to Columns, you should have the following:
Right click on the Brand pill, click on Sort and sort it descending by the SUM of Value, be sure to select the Bar chart type. CTRL drag the Brand pill to the Label Card and align it to the left. To create the ranking text label we are going to need the following calculation:
[Rank Label]
"#" + STR( INDEX() )
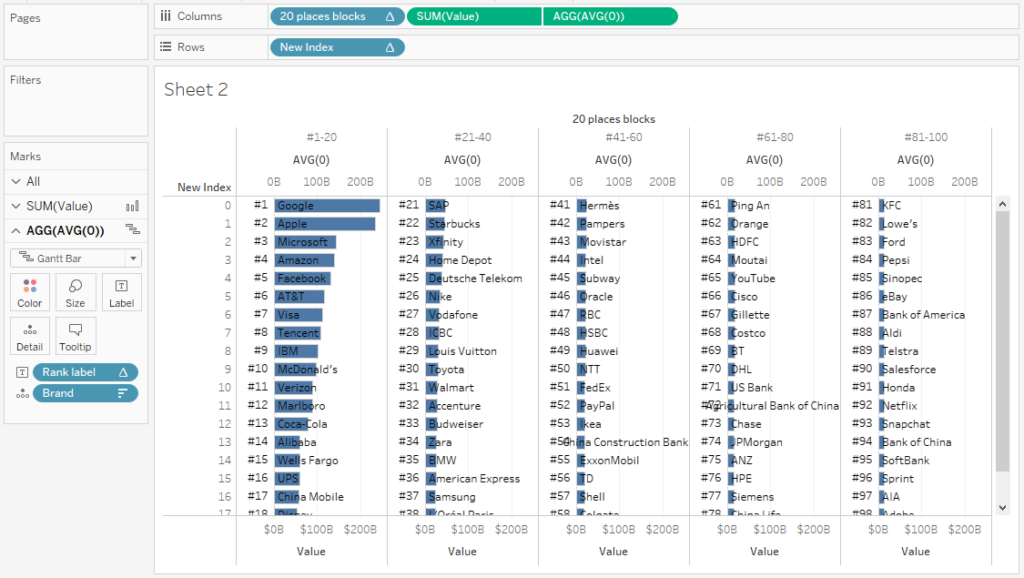
Now create an in-line calculation besides the SUM(Value) pill in the columns with the following formula AVG(0), this is just a placeholder for our rank labels. Make this mark a Gantt chart type and remove the Brand field of the Label Card, you should have the following:
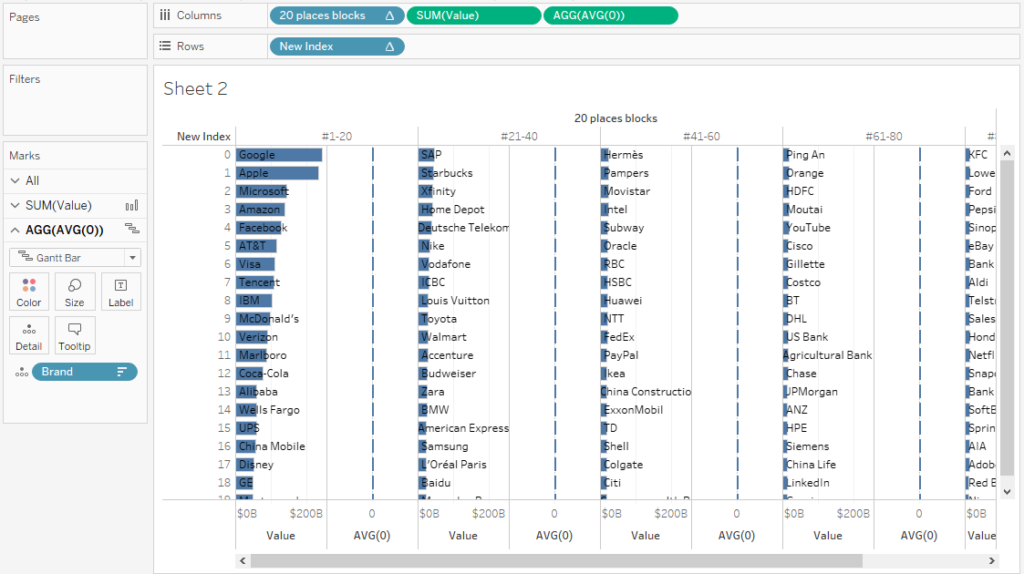
Right click on the AGG(AVG(0)) pill and select Dual Axis then synchronize both axes, remove the auto generated Measure Names pill from the Color Card. Drag the Rank Label calculation to the Label Card in the AVG(0) mark section and set it to Compute using Brand. Make the Gantt marks the smallest possible and totally transparent with no border. You should get the rough draft of the final version:
From here you just need to polish it by playing with the formatting, I’ll leave that to you.
It isn’t as tough as it looks once you understand the power of the modulo operator, be sure to take a deep look at it because you can apply it to many tricky situations.
That’s it for today, remember to wash your hands frequently, don’t touch your face, use a face mask and be safe!