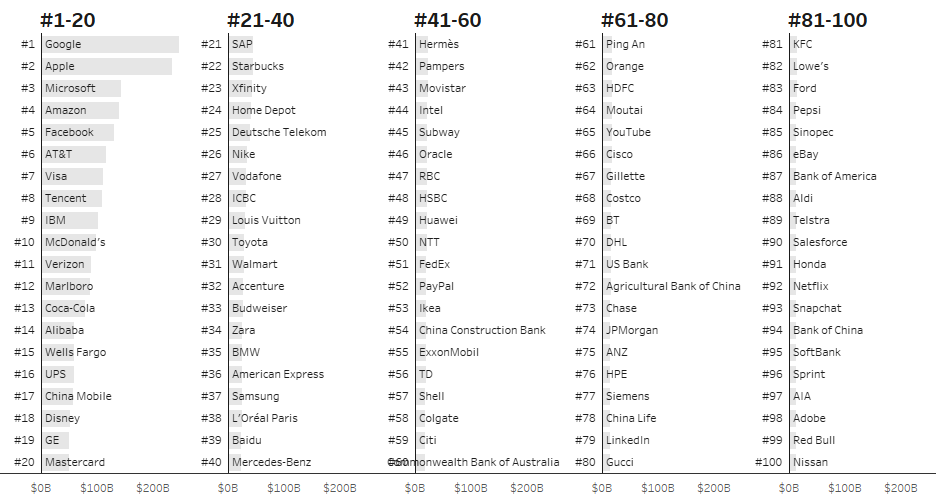
How to show grouped bars in a Bar Chart
Hello everybody, I hope every one of you is healthy and doing OK. I haven’t written in a long time and I wanted to get back to write another blog post, maybe I can distract you from all the bad news. Recently I stumbled upon an old Tableau WorkoutWednesday challenge
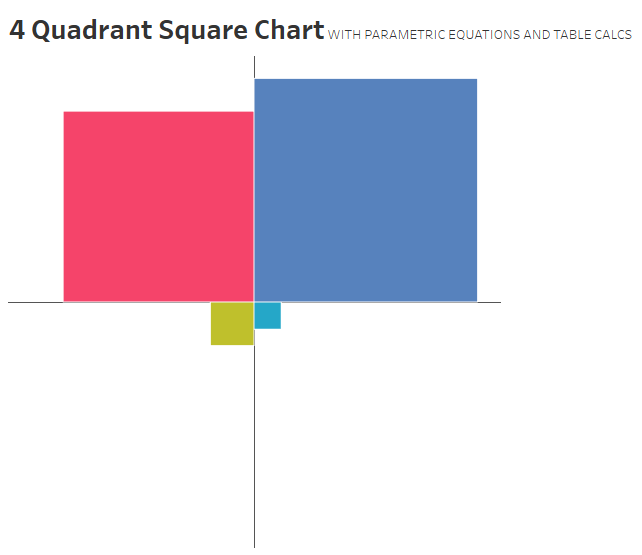
4 Quadrant Square Chart, another method
Hello everybody, I bet you had a great time at TC19! For those of us who stayed at home we had a great time watching the sessions online, I don’t need to be in Vegas! (I do!). Some time ago 4 quadrant square charts were the thing in our Tableau
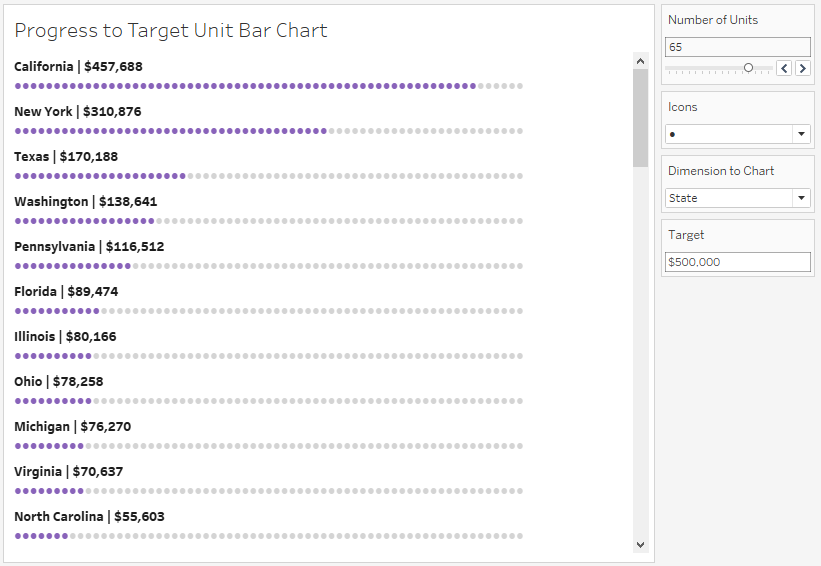
Unit Bar Charts that aren’t
Hey datafam, I’m back with a new blog post that is long overdue! Some weeks ago, I noticed that my Tableau buddy, Rodrigo Calloni, asked how to do a Unit Chart with the category labels on top of the bars. There a couple of great tutorials on how to do
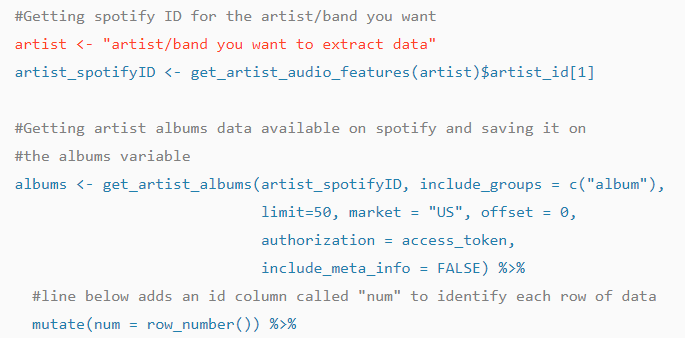
Getting data from Spotify
Hello data and music lovers! On this post I’m going to share with you how to get data from your favorite artists and their albums from Spotify. Recently my wife got us a subscription to Spotify and I was wondering if this app with a huge collection of artists and
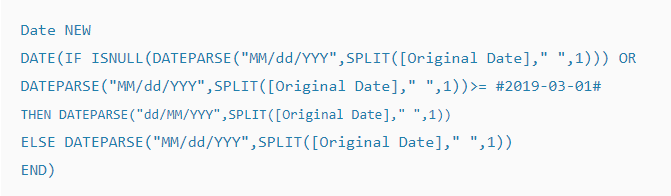
Dates are tricky!
Hello everyone! This is my first technical blog post and today we’re talking about a recent challenge that I had while working on a client’s project. It’s about dates in Tableau, and as you probably already know dates can be quite tricky! The underlying data had a date field that
My long Data Viz journey
Hello there, Adolfo here! This is my very first blog post on my very first website Bold Analytics! My main purpose will be to provide you useful and interesting content. On this first post I want to tell you how I ended on Data Visualization. If you’re part of the